Debug With GDB
Debug With GDB
Install & plug-in
Install gdb and choose one of the plug-ins to start you GDB!
sudo apt install gdb
peda+pwngdb
cd ~/
git clone https://github.com/longld/peda.git ~/peda
git clone https://github.com/scwuaptx/Pwngdb.git
cp ~/Pwngdb/.gdbinit ~/
GitHub - longld/peda: PEDA - Python Exploit Development Assistance for GDB
GitHub - scwuaptx/Pwngdb: gdb for pwn
pwndbg
git clone https://github.com/pwndbg/pwndbg
cd pwndbg
./setup.sh
GitHub - pwndbg/pwndbg: Exploit Development and Reverse Engineering with GDB Made Easy
gef
bash -c "$(wget http://gef.blah.cat/sh -O -)"
Commands
Command start & set args
I’ll introduce the main command we will use to debug a program.
First, there are two ways to debug a program: attach to the progress or run the program by GDB.
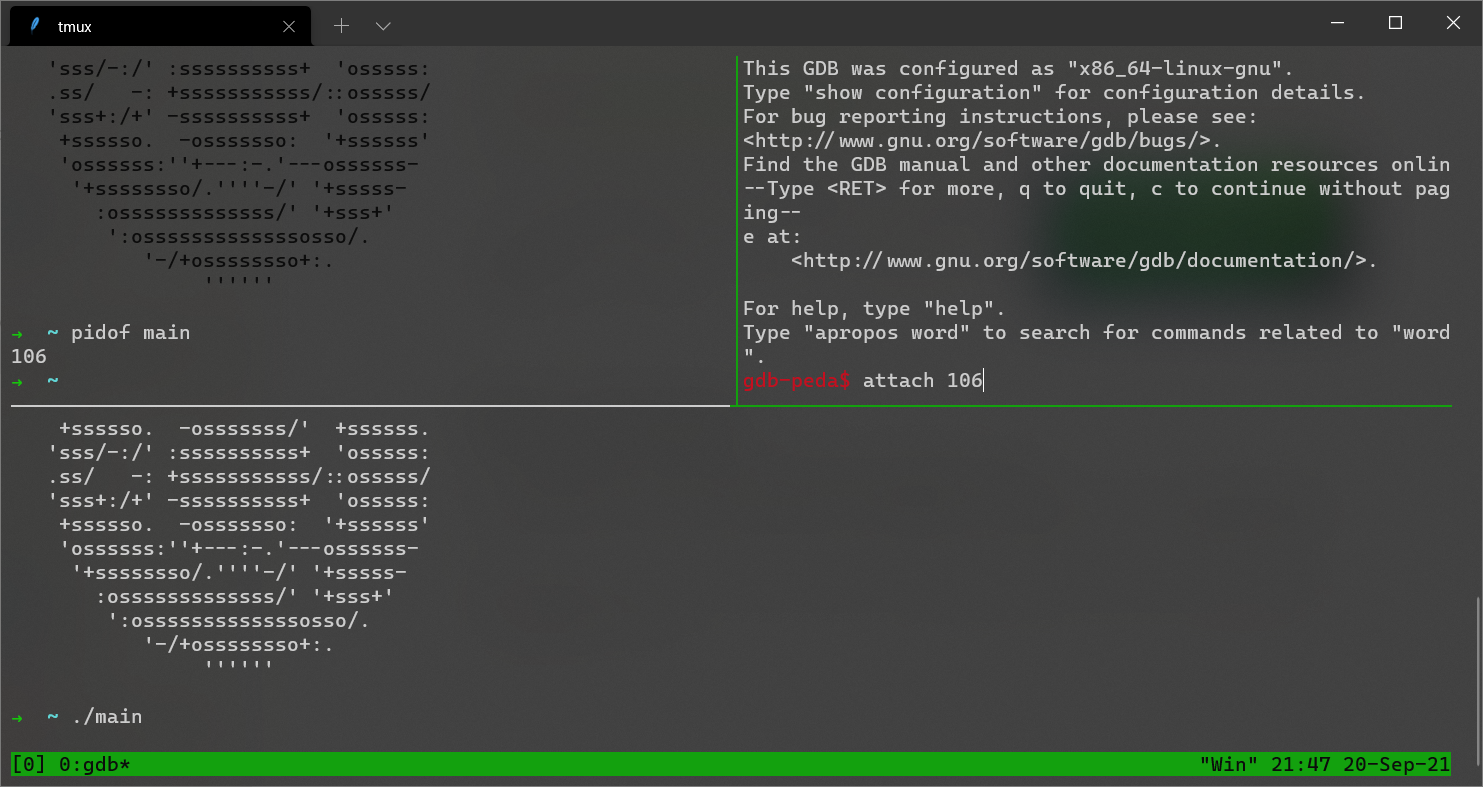
For attaching to the progress, we would run the program and use the command of pidof tp get the PID of the progress. Then we can attach to the progress in GDB by the GDB command attach [pid]. The limitation of this method is obvious: we can’t debug the program does not block. However, this method is useful in some situations. For example, while debugging some programs in industry environment you will find this method really useful.
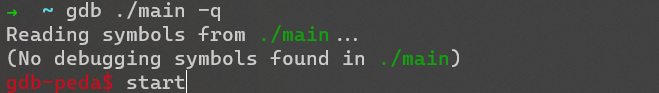
There is another more easy way to debug a program by GDB. We could use the command of gdb [theNameOfBinary] to start GDB. and use start to start the program. If we want to set the parameters of binary, we could use the GDB command set args [prameter1] [prameter2] ... to set the parameters.
-
Trick 1:
If you want to debug some function before main, you can just set the breakpoint before running the program.
Command ni & si
After starting, we need to track the program. There are 2 super useful commands: ni , si. Commands ni&si are the assembly language level. ni is the abbreviation of next instruction , which means go one instruction over and will not go into any functions. si is the abbreviation of step instruction, which means go one instruction over and will go into any functions.
Command breakpoint
And another important feature is breakpoint. We could use
bto set a breakpoint at current addressb *[addresse]to set a breakpoint at[address], exampleb *0xdeadbeefb [function_name]to set a breakpoint at a function, exampleb maininfo bto list all the breakpointsdelete [numberOfBreakpoint]to delete a breakpoint
After setting the breakpoint, we usually use c or run to run the program until it hit a breakpoint.
-
Trick 2:
While debugging the program with PIE (A mitigation will randomly set the base of the code segment). It’s hard to reuse a breakpoint when we use attach to debug a function. To reuse breakpoint and make it more easier, we can just close the ASLR (PIE is included by ASLR):
echo 0 | sudo tee /proc/sys/kernel/randomize(Ubuntu). After that we can quickly find the address we want to set a breakpoint, we could combine GDB and IDA by use a feature of IDA:rebase.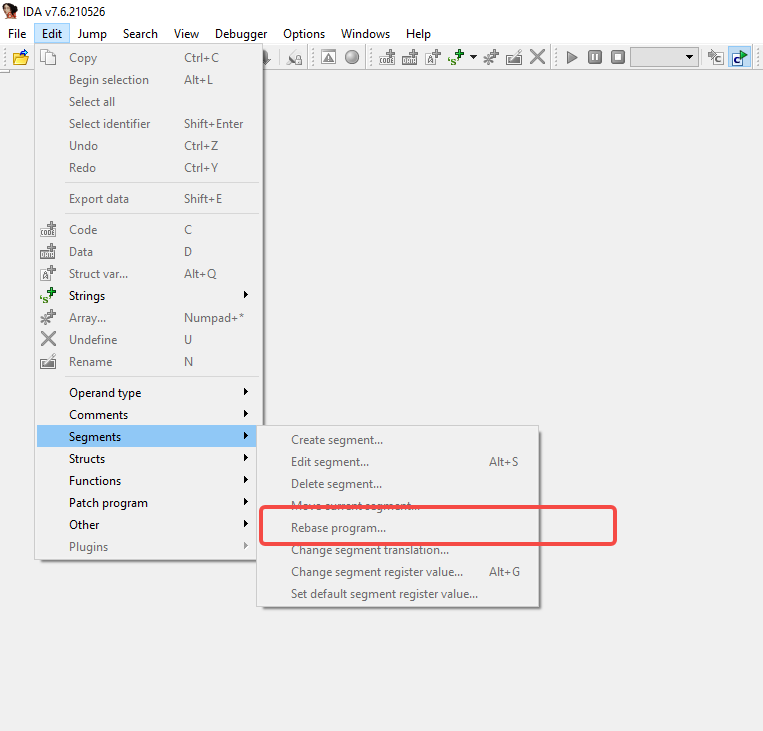
Command print & x
At the end of this section, I would like to introduce some print command p and x.
p is the abbreviation of print, we could use it to print some variable, such as p $rdi and p *0xdeadbeef . And x is a good choice to show the memory, we usually use x/8gx [address] to dump the memory. The first x means command x, and the parameter 8 means 8 times; and g means 64bits btw w means 32bits; and x means to print the result in hex, it could also be used in p for p/x $rax . This command it important please use it anytime when you feel confuse while debugging.
example
Print the data in hex:x/8gx 0x55555000
Print the data in string: x/8s 0x55555000
Print the data 4bytes by 4bytes: x/8wx 0x55555000
-
Trick 3:
If you press
enterwithout any command, GDB will repeat the latest command. This trick is usually used onx/8gxnisic
Command finish
Another very useful command, when you are in a function and you wanna get out of it. You can use finish to finish current function. However, sometimes it’s not reliable and you need to use si or ni to get the end of funtion.
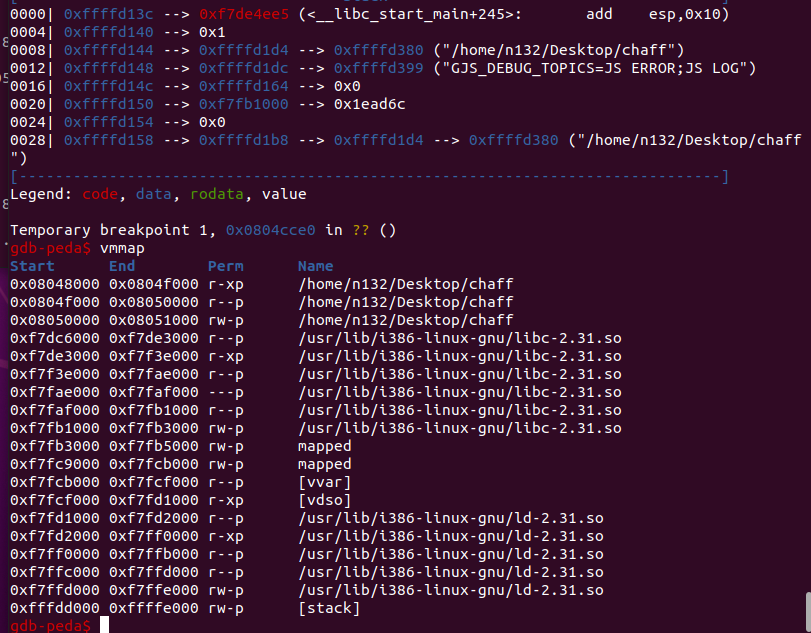
Command vmmap
command vmmap would print the memory layout so that you can find the libc-base address, heap-base address, and bss address.
Command backtract(bt)
A backtrace is a summary of how your program got where it is. It shows one line per frame, for many frames, starting with the currently executing frame (frame zero), followed by its caller (frame one), and on up the stack.
Command next and step
commands n&s are the source code level, and they are usually used while debugging the binary with source code. And we can get these binaries by using GCC command gcc ./main.c -o main -g. n is the abbreviation of next , which means go one next line (source code line) over and will not go into any functions.s is the abbreviation of step, which means going one line (source code line) over and will go into any function.
Command watch
If you wanna locate a crash/condition, you can use watch.
watch $rdi==0xdeadbeef means if $rdi==0xdeadbeef, then stop. We can also use *[address] == [value] to set an conditional breakpoint. Or we can just use watch [address] or watch [rigister] to track the changing of registers.
example:
watch $rdi=0xdeadbeef
watch 0xdeadb000
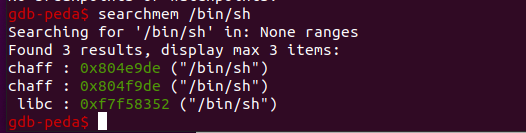
Command searchmem (peda)
The last command I think is super helpful is searchmem, we can search everything: string and data.
usage:
searchmem [string]/[address]
example:
searchmem /bin/sh
searchmem 0xdeadbeef